In this blog, we will look at best practices for presenting tables and figures in your research paper. You must try to present your results in figures and tables wherever possible. This is a fantastic way to summarize large amounts of data in a visually pleasing way.
1. When to use Figures and Tables in a Research Paper?
One of the common questions asked by students is when should they present the data in figures and tables instead of putting it directly in the text. The best way to answer this question is if you cannot present your data in your text in one or two lines, then you should consider putting it in a figure or a table.
Tip: If you cannot present your data in your text in one or two lines then use a Table or Figure.
Another common question that comes up is how to choose between a figure and a table for presenting the data. The best way to answer this question is if you want to illustrate the trends and patterns in the data, then a figure is the best option. If you want to show the actual values or present a lot of numerical information in your paper. Then, a table might be the best way to go.

2. An Example of Table and Figure Usage
Here is an example. Look at the way the authors have used tables and figures to describe their results.
✔ The author explains the trend using a figure and points the reader to the table for full data
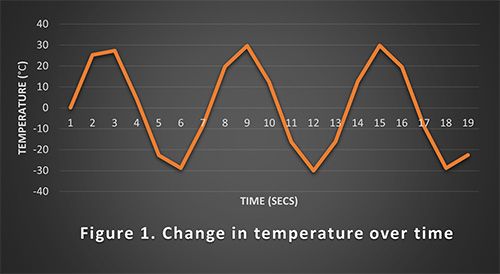
In Figure 1.1, the values are plotted as a function of time. The two peaks in the plot correspond to the maximum and minimum temperature values. The specific values obtained for each experiment are given in Table 2.
In the first couple of lines, they are talking about a trend in their data that relates to the change in temperature over time. They are constantly referring to the figure to get their point across to the readers. And finally, in the last sentence, they are telling the readers that the actual numerical data is provided in the table, and they can refer to it if they want. This is a standard way to use figures and tables in your research paper.
3. Best Practices for Using Tables & Figures
When you are using figures and tables in your paper, you must reference them in your text. You cannot have a figure in your paper and not talk about it in your text.
Best practices
Another important thing is that your figure should have a caption that clearly explains what is it about. Most people skim through the paper just going through figures and tables without reading any text in the paper. So, captions should be as short as possible but detailed enough for the readers to understand the figure or table without having to read the text.
4. Common Mistakes to Avoid
A common mistake made by both beginner writers and experienced writers is repeating the figure caption in the text when referring to the figure in the paper. Look at the following example, the author repeats exactly what it says in the figure caption in the text. The author is saying that the figure shows the change in temperature over time. This is already mentioned in the figure caption, there is nothing new here.
✖ Bad example – Repetition of figure title in the text when referring to it
Figure 1 shows the change in temperature over time.
Now, look at the example below. While referring to the figure, the author provides some additional information to the readers by talking about an interesting trend in the figure instead of just repeating the figure caption.
✔ Good example – Interesting fact provided about the figure when referring to it
The temperature fluctuation over time follows a sine wave pattern peaking at 30 degrees (Fig 1).
5. Summary
Tables and figures are important parts of your research work. They are your secret weapon for clearly presenting your data to your readers. We strongly recommend that you prepare the list of figures and tables that you want to include in your work before you start writing the text. Please follow the instructions provided in this blog while adding figures and tables to your research paper. If you have any questions, please drop a comment below, and we will answer as soon as possible. We also recommend you to refer to our other blogs on academic writing tools, academic writing resources, and academic phrase-bank, which are relevant to the topic discussed in this blog.