In this blog, we will explain how to write a research paper that employs a survey questionnaire. We will discuss all the important points to consider while writing the research paper. The title of our research paper is ‘Understanding online shopping behaviors of older population – A questionnaire study.’ Please note that this is not a real paper. It is an example paper we put together for the purpose of teaching.
Understanding Online Shopping Behaviors of Older Population – A Questionnaire Study
Research Paper Title
1. Introduction

Let’s start with the introduction paragraph. This is where you provide a general overview of the topic. Let’s begin with a strong opening statement. This is normally called a hook since you are trying to hook your readers to your paper. Here we are providing some interesting numbers about the elderly population. We are saying that by the year 2050, more than 30% of the world’s population will be over 60.
Then we follow it up with a future prediction. We are saying that the spending power of the elderly population will increase significantly in the next few years. This is a fantastic way to emphasize the importance of the topic. Now with the next statement, we are highlighting the topic’s timeliness. We are saying that this is a hot topic that has not yet been fully explored.
In comparison to today, the UN predicts that by 2050, more than 31% of world’s population will be 60 or older [1]. It is expected that senior citizen’s purchasing power will reach £50 trillion by 2030. Researchers should therefore be interested in this growing and relatively unexplored segment of the online market.
Introduction paragraph
2. Literature review

Now let’s move on to the literature review. A literature review is an overview of previously published works related to your topic. Let’s start with a broad summary of the previous research activity in this field. We are saying that the topic of consumer behavior is well-studied. Then, we are grouping prior research into three main categories. This statement is a very good example of how to condense and summarize the findings of multiple research papers in one sentence.
There exists a vast amount of literature on the topic of consumer behavior in marketing [1-3]. Existing literature generally explores: personal factors [4-6], psychological factors [7-10], and situational factors [11-13]. There are very limited previous research findings related to the shopping behaviors of the older population. This study, to the best of our knowledge, represents the first attempt to fill the void in the literature.
Literature review & Research gap
Now it’s time to establish the research gap. A research gap is an unexplored or understudied area in the literature that you have identified. We are saying that there are very limited studies focusing on the consumer behaviors of the elderly population. And we are trying to address this particular gap in our work. Then we talk about the novelty component of our work. We are saying that, to the best of our knowledge, this is the first study to investigate this particular issue.
3. Research question

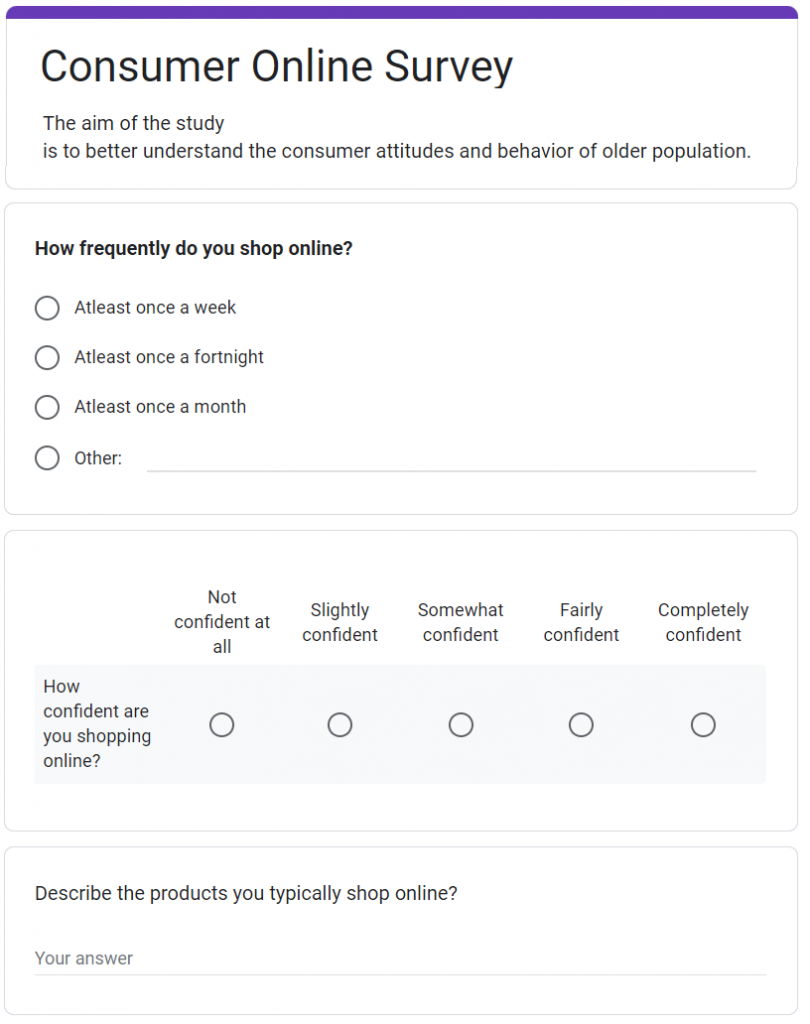
Let’s talk about the research questions. You have to describe what you intend to accomplish in your research. The aim of the study is to better understand the consumer attitudes and behavior of the older population. We will find this out by using a questionnaire survey.
The aim of the current study was to better understand various factors that influence the attitudes and behaviours of older customers. We employed a survey questionnaire for addressing the research questions at hand.
Research aims & method summary
This concludes the introduction section of the research paper and lets us move on to materials and methods.
4. Materials and methods
Materials and methods section should be written very clearly with a detailed account of the procedure that was followed in the experiment. The information in this section should be adequate for anyone desiring to replicate the study in the future.
4.1. Participant recruitment and Questionnaire administration
First, you have to explain how the participants were recruited for the study and clearly define your target population. In our case, we have decided to use customers over the age of 60 from an online shopping website. Then we have to explain how we selected the participants for the study.

There are many different types of sampling methods. For example, we have Random sampling, Systematic sampling, Convenience sampling, Cluster sampling, and Stratified sampling. You would have noticed people stopping you in shopping malls for a short survey. This is called convenience sampling. In systematic sampling, you pick every 5th or 10th customer from the database. In our case, we used a random sampling method, which means we randomly picked participants from the database.
The database of customers over the age of 60 who agreed to participate in the survey was collected from the Amazon e-retailer webiste. The respondents were selected by using simple random sampling method from the retailer’s database. A link to the survey was emailed to customers of the e-retailer who agreed to participate in the survey in exchange for a discount coupon.
Population, sampling and questionnaire adminstration
Now, you have to explain how the questionnaire will be administered. There are so many different ways in which we can do it. We can do this via phone interview, personal interview, written questionnaire, or online questionnaire. All the methods have both advantages and disadvantages. In our case, we used an online questionnaire that was emailed to the customers who agreed to participate in the study.
4.2. Questionnaire design and development
Let’s explain the number of questions the survey contains. In our case, we had 24 questions covering various topics. Let’s talk about different types of questions. There are different types of questions. For example, we have open-ended questions, close-ended questions, Likert scale questions, rating scale questions, yes/no questions, and text questions.
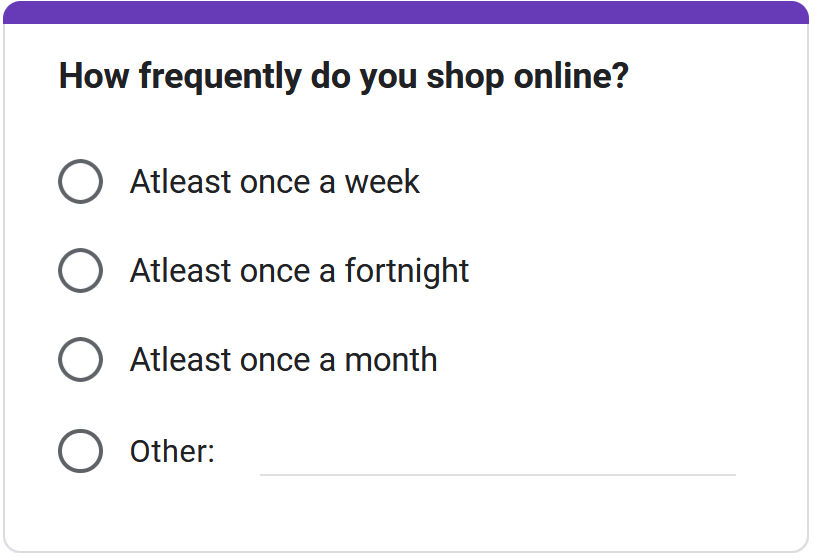
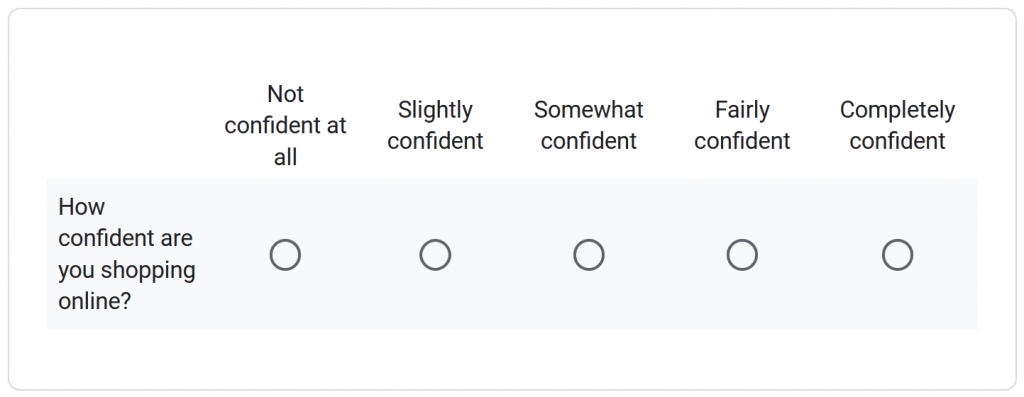
The questionnaire consisted of 24 questions that covered key issues around shopping behaviour and reasons for shopping. The frequency of shopping was reported as one of three categories: once a week, once a fortnight, and once a month. The confidence in shopping was determined by asking respondents to rate on a five-point Likert scale. The participants were asked to describe the type of things they shop in a free text box.
Questionnaire design
Here we are reporting the frequency of shopping in three categories, once a week, once a fortnight, and once a month. This is a close-ended question since the answers are limited to a fixed set of responses. When designing a close-ended question, it is a good idea to provide an extra option to capture the answers that are not available in the choices. Then, we are using the Likert scale to understand how confident the participants felt while shopping online. The Likert scale is a very popular scale used to ask the participants how much they agree or disagree with a particular statement.
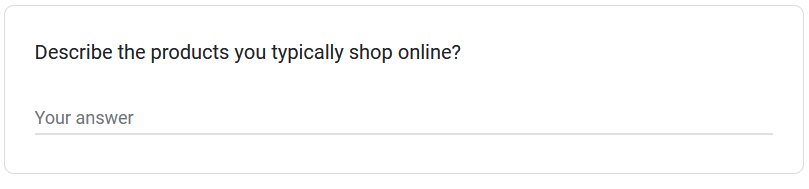
We ask respondents to indicate what sort of stuff they typically purchase online. This is an open-ended question, and we use a free text box to capture the answers. The respondents are free to say what they like. This is particularly useful when you don’t know how people are likely to respond to a question. This is also a good option when you don’t want to influence the participants’ responses. The only problem you should bear in mind is that there are so many different ways the open-ended questions could be answered. This makes the analysis process a bit difficult. So, if you decide to use open-ended questions in your survey, make sure you talk to a statistician first.
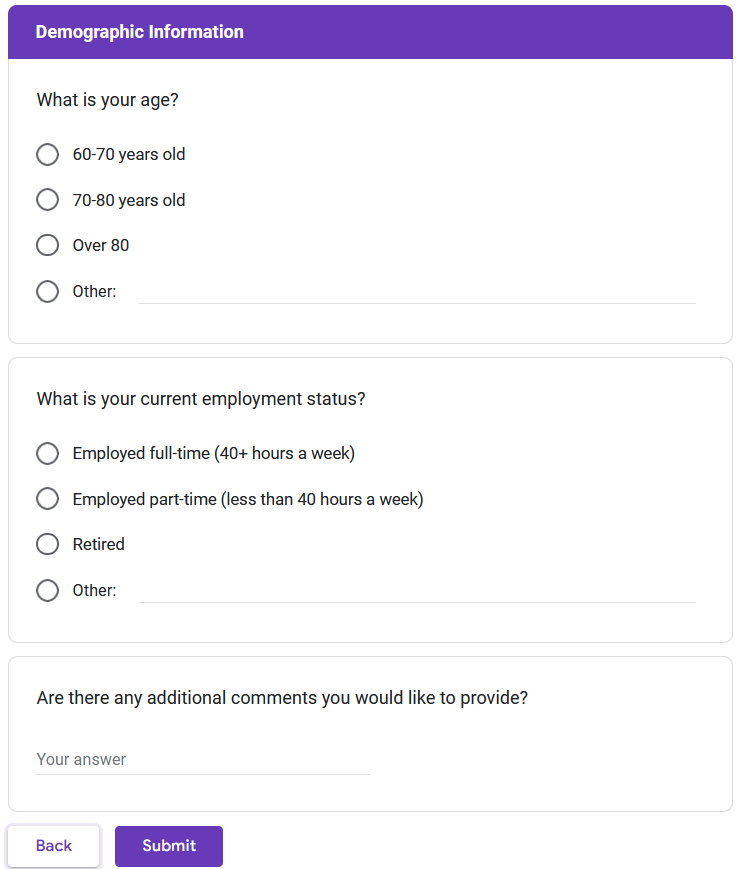
Typically, an online questionnaire starts with a short description of the study followed by the survey questions. In the end, you will ask the participants for demographic information such as age and gender. It is also a good idea to provide a free text box so the participants can provide feedback or raise concerns about your study. Finally, thank your participants after completing the questionnaire.
4.3. Questionnaire testing

Normally when you are administering a questionnaire in multiple languages, the questionnaire is first produced in the main language and then translated into multiple languages. In our case, the questionnaire was first produced in English and then translated into Welsh and Irish. Finally, the translated versions are back-translated into English and checked to make sure there are no discrepancies. Make sure you do a pilot survey. This will help you identify any potential problems in your questions and allow you to fix them before it is too late. Keep repeating the pilot study until you are happy with the questionnaire.
The questionnaire was developed in English and was then translated into Welsh and Irish. The questionnaire survey was pretested among a group of experts to confirm the survey design and text wording.
Questionnaire translation & pilot study
5. Results

Let’s start with the survey response numbers. In our case, the survey response rate was 31.6%. The response rate can be calculated by dividing the number of completed survey responses by the number of people who viewed or started the survey. Then, follow it up with demographic information of the respondents who participated in the study. In our case, we are presenting the demographic data in a table.
Now let’s look at different ways to report survey data. One simple way of reporting is to provide the percentage of participants who chose a certain response for a question. In our case, 80% of respondents said they shop at least once a week.
The survey was administered online to 3,000 customers. 950 completed the survey, resulting in a response rate of 31.6%. The details of basic demographic data are provided in Table 1. When asked how frequently they shop online, 80% of respondents replied at least once a week. The average response was “4: Fairly confident” for the overall rating of the confidence of shopping online. Overall, the majority of the participants stated that they shop for everyday items online, and only a small proportion indicated seasonal products. In conclusion, this research significantly improved our current understanding of shopping behaviors of older population.
Results
The question about the confidence of shopping was on the Likert scale. Here, we are saying that the participants’ average response was “Fairly confident.” I must mention that there are so many other ways you can present Likert scale data. For example, you can visualize the entire distribution and present it as a figure in your paper.
Another way of reporting data is by using broad generic terms such as majority, minority, a large proportion, small proportion, etc. You can do this, but be careful because different readers might interpret these terms differently. Let’s finish up the paper with a conclusion statement that nicely summarizes our work and key contributions.